Microscopy, Python, and Open Source: From Pixels to Infinity
.webp)

At Ramona, we care deeply about how images are captured and displayed. Over the last few years, we’ve leveraged and contributed to open source software mostly by opening bug reports, suggesting fixes, and helping package scientific software for the community at large.
Today, we celebrate our first sponsorship of an open source project, the Pygfx project! Pygfx, pronounced “py-graphics”, is a Python library with the purpose to bring powerful and reliable visualization to the scientific python ecosystem. If you are interested in python and image visualization, we recommend you go check out the website. At Ramona, we leverage its capabilities to display our Gigapixel data right to your screen allowing you to interact with every single picture captured by the MCAM®.
As a celebration, we choose to study a common problem relatable to anybody trying to visualize content to a screen and realize that as they enlarge their image, their data starts to look blurry. In this blog post, we decide to focus on one of the simplest images, that of a logo, our logo!!! As we alluded to, if you try to zoom into our 128 x 128 pixel logo, you’ll quickly see that the quality appears to degrade!

In fact, the quality doesn’t degrade, but rather the finite resolution of the underlying image shows its limits! However, at Ramona, our mission is to make you forget about pixels and bits and let you focus on biology, science, and discovery! One popular solution is to use vector graphics to draw in a scalable fashion — our marketing team loves to use those to make our swag look amazing!
In order to celebrate our new sponsorship of the Pygfx projects, we are deciding to redraw the logo you see on the MCAM® software in a pixel perfect fashion using some of the latest capabilities of the library!

The before and after are quite stark, read along if you want to learn how we achieved this!
How many pixels should your logo have?
When acquiring microscopy data, one can often estimate the number of pixels required for a given experiment by considering the size of the biology of interest. However when drawing a picture on a monitor, one cannot always determine the resolution of the display used to render this image. Many times, one has to guess an adequate resolution for an image, save the image in a PNG format to avoid compression artifacts, and hope that most users don’t zoom in too much to notice any inconsistencies at edges. However, with 4k and 8k screens, scientists can often zoom much more than they used to! It would be nice to have infinite pixels!!!! But for that we must decompose the logo into a mathematical formula that can be computed based on the final resolution.
In computer graphics, one strategy often used is based on signed distance field, SDF for short. The idea behind an SDF is to provide a formula for the distance from any pixel to the edge of the shape. If one can find a closed form formula, then the drawing can have “infinite” resolution giving us sharp edges. Pixels that are “inside the shape” are tagged as “negative” by convention. This allows one to color pixels with a negative distance with one color, and pixels with a positive distance in another. For more information we recommend users read Rougier’s Paper on creating pixel perfect markers for scientific communication on the GPU which can be retrieved on this link as well as some great posts and videos by Inigo Quilez found here.
The examples below use the Pygfx engine developed by Almar Klein and the rest of the Pygfx team!
The Ramona Logo
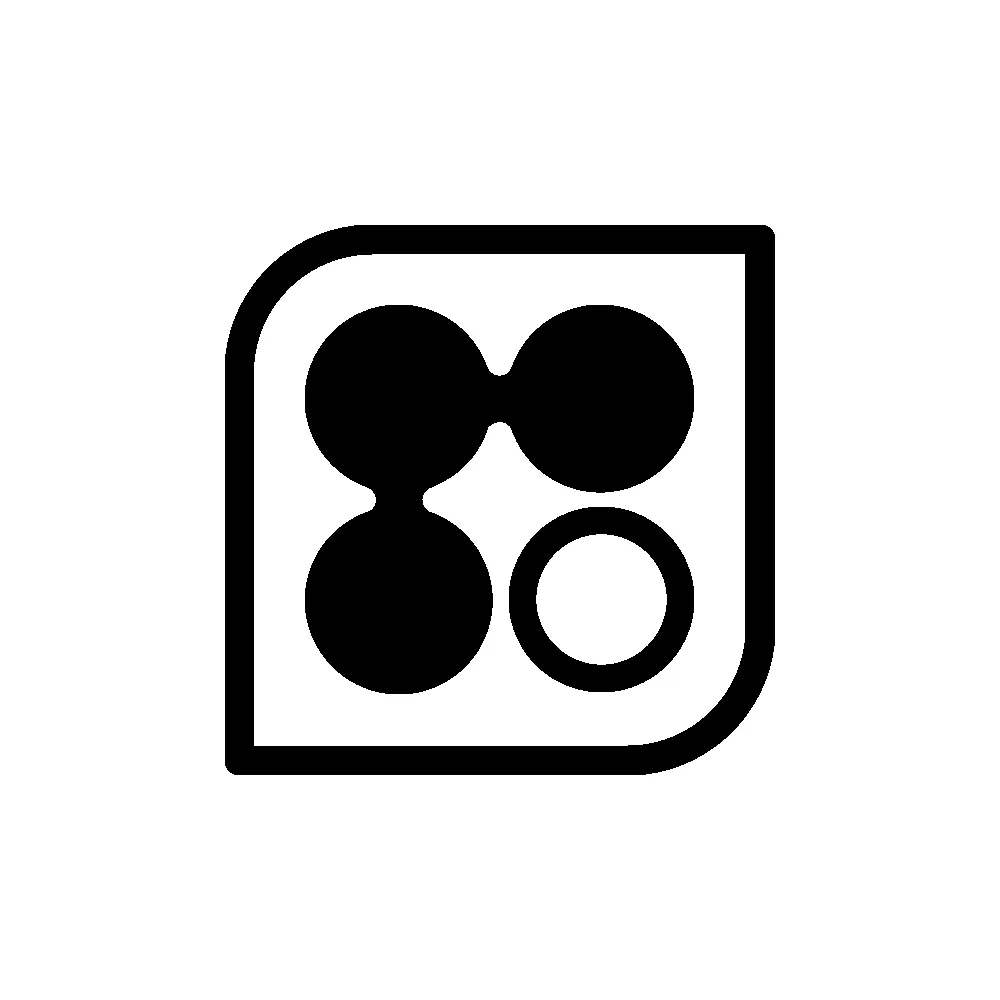
The first step is to decompose the Ramona Logo into a series of primitive shapes for which we can write down a formula.
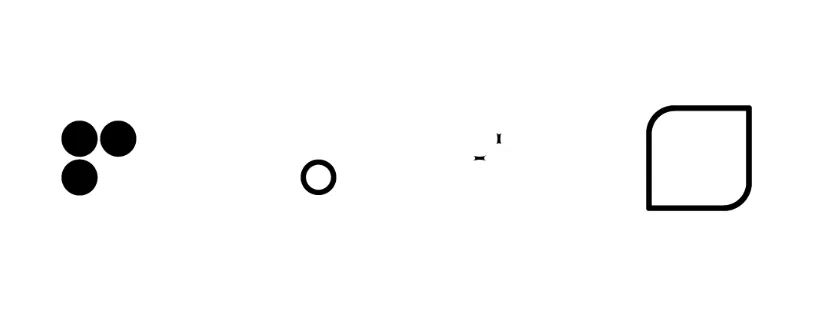
We will break up the logo into 4 different components:
- The 3 filled circles
- The ring in the lower right hand side
- The circle connectors
- The outer perimeter
We will define a formula for each of these and combine all four (4) formulas into a single one for the final rendering.
Starting it all off with Pygfx
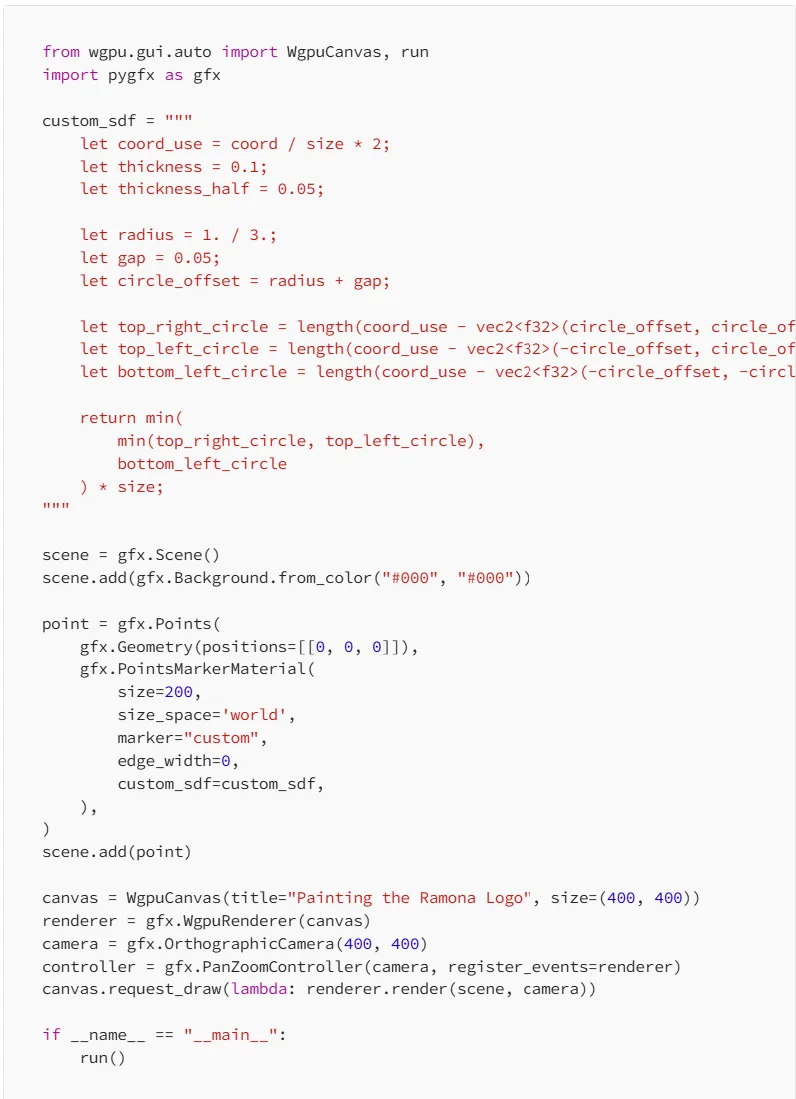
We will want to create our WebGPU canvas to be able to start drawing. For this we will create a small script that places a single point on the scene and use Pygfx markers to define the shape. Because we want to be able to interact with the logo, we will use a few of Pygfx’s features to allow us to get closer and further away from the logo. This is the same technology that allows you to zoom in and out of the massive images captured by Ramona’s MCAM®!
.webp)
Python
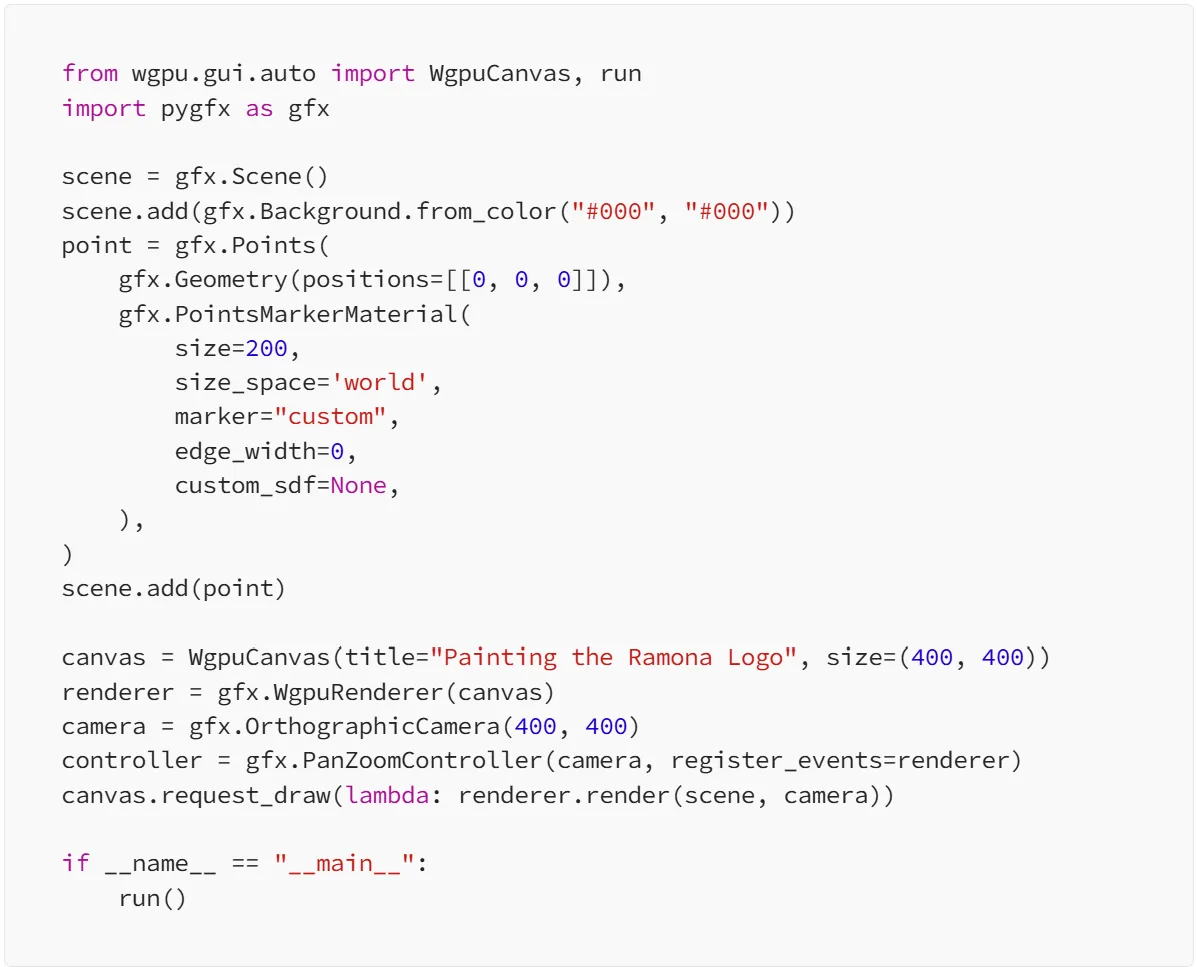
In the code above, we’ll start to specify the parameter custom_sdf with the mathematical function we will construct.
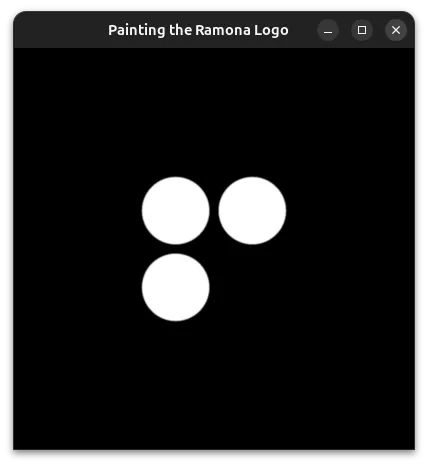
The three circles
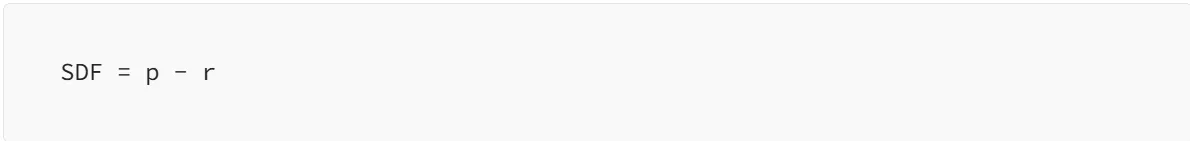
where p is the position on the screen that we are trying to paint, and r is the radius of our circle. In English, this gives us an equation that takes on a value of 0 exactly at the radius of the circle, negative values for the point inside the radius, and positive values for points outside the radius. If you want to experience what the SDF looks like in an interactive fashion, I can point you to IQ’s online shader website (link here) called where draws the SDF of a perfect circle. The blue regions denote the “negative” distances, while the orange denotes the “positive” distances. By clicking on the image, a circle with radius equal to the absolute distance will be drawn.
To draw all 3 circles, we will use a key concept behind signed distance field for non-intersecting shapes: the signed distance field can be computed by taking the minimum of the signed distance of each independent shape. To write this formula for Pygfx to use, we must write a short piece of code in WGSL, a modern programming language for GPU rendering, that expresses the mathematics required to evaluate the SDF above. In Python the full code used to draw our three circles looks like:
Python
For brevity, we’ll start to omit the python code portion in future examples and only include the contents of the custom_sdf string variable which defines our SDF.
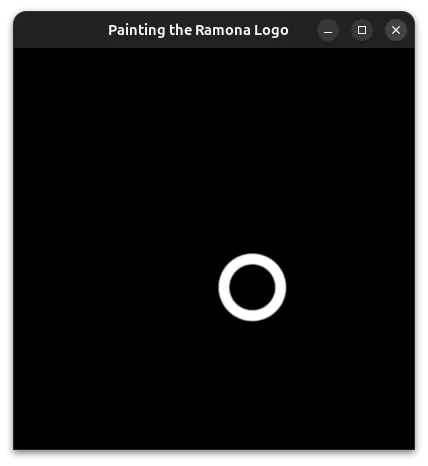
The ring
To define a ring, we’ll take the formula for a circle and make it an annular shape of thickness t.
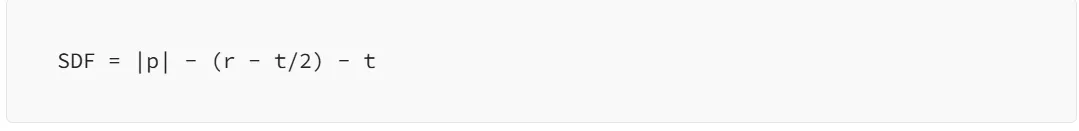
We take care to subtract the thickness from the radius of this shape so that the outer edge of the ring has the same size as the previous three circles.
let coord_use = coord / size * 2;
let thickness = 0.1;
let thickness_half = 0.05;

let radius = 1. / 3.;
let gap = 0.05;
let circle_offset = radius + gap;

let bottom_right_circle = length(coord_use - vec2<f32>(circle_offset, -circle_offset)) - (radius - thickness_half);
let bottom_right_ring = abs(bottom_right_circle) - thickness_half;

return bottom_right_ring * size;
Stay tuned for Part 2!
In the next installment, we'll tackle the more challenging aspects of our logo: the mathematical puzzle of the circle connectors (hint: coins on my desk provided unexpected inspiration!), the outer perimeter with its elegant rounding, and how we solve a real gigapixel microscopy challenge - making the logo look perfect on any background, from dark fluorescence to bright-field images.
Check out Part 2: Perfecting the Details where we complete our journey to a truly pixel-perfect, infinitely scalable logo!
At Ramona, we care deeply about how images are captured and displayed. Over the last few years, we’ve leveraged and contributed to open source software mostly by opening bug reports, suggesting fixes, and helping package scientific software for the community at large.
Today, we celebrate our first sponsorship of an open source project, the Pygfx project! Pygfx, pronounced “py-graphics”, is a Python library with the purpose to bring powerful and reliable visualization to the scientific python ecosystem. If you are interested in python and image visualization, we recommend you go check out the website. At Ramona, we leverage its capabilities to display our Gigapixel data right to your screen allowing you to interact with every single picture captured by the MCAM®.
As a celebration, we choose to study a common problem relatable to anybody trying to visualize content to a screen and realize that as they enlarge their image, their data starts to look blurry. In this blog post, we decide to focus on one of the simplest images, that of a logo, our logo!!! As we alluded to, if you try to zoom into our 128 x 128 pixel logo, you’ll quickly see that the quality appears to degrade!
In fact, the quality doesn’t degrade, but rather the finite resolution of the underlying image shows its limits! However, at Ramona, our mission is to make you forget about pixels and bits and let you focus on biology, science, and discovery! One popular solution is to use vector graphics to draw in a scalable fashion — our marketing team loves to use those to make our swag look amazing!
In order to celebrate our new sponsorship of the Pygfx projects, we are deciding to redraw the logo you see on the MCAM® software in a pixel perfect fashion using some of the latest capabilities of the library!
The before and after are quite stark, read along if you want to learn how we achieved this!
How many pixels should your logo have?
When acquiring microscopy data, one can often estimate the number of pixels required for a given experiment by considering the size of the biology of interest. However when drawing a picture on a monitor, one cannot always determine the resolution of the display used to render this image. Many times, one has to guess an adequate resolution for an image, save the image in a PNG format to avoid compression artifacts, and hope that most users don’t zoom in too much to notice any inconsistencies at edges. However, with 4k and 8k screens, scientists can often zoom much more than they used to! It would be nice to have infinite pixels!!!! But for that we must decompose the logo into a mathematical formula that can be computed based on the final resolution.
In computer graphics, one strategy often used is based on signed distance field, SDF for short. The idea behind an SDF is to provide a formula for the distance from any pixel to the edge of the shape. If one can find a closed form formula, then the drawing can have “infinite” resolution giving us sharp edges. Pixels that are “inside the shape” are tagged as “negative” by convention. This allows one to color pixels with a negative distance with one color, and pixels with a positive distance in another. For more information we recommend users read Rougier’s Paper on creating pixel perfect markers for scientific communication on the GPU which can be retrieved on this link as well as some great posts and videos by Inigo Quilez found here.
The examples below use the Pygfx engine developed by Almar Klein and the rest of the Pygfx team!
The Ramona Logo
The first step is to decompose the Ramona Logo into a series of primitive shapes for which we can write down a formula.
We will break up the logo into 4 different components:
- The 3 filled circles
- The ring in the lower right hand side
- The circle connectors
- The outer perimeter
We will define a formula for each of these and combine all four (4) formulas into a single one for the final rendering.
Starting it all off with Pygfx
We will want to create our WebGPU canvas to be able to start drawing. For this we will create a small script that places a single point on the scene and use Pygfx markers to define the shape. Because we want to be able to interact with the logo, we will use a few of Pygfx’s features to allow us to get closer and further away from the logo. This is the same technology that allows you to zoom in and out of the massive images captured by Ramona’s MCAM®!
Python
In the code above, we’ll start to specify the parameter custom_sdf with the mathematical function we will construct.
The three circles
where p is the position on the screen that we are trying to paint, and r is the radius of our circle. In English, this gives us an equation that takes on a value of 0 exactly at the radius of the circle, negative values for the point inside the radius, and positive values for points outside the radius. If you want to experience what the SDF looks like in an interactive fashion, I can point you to IQ’s online shader website (link here) called where draws the SDF of a perfect circle. The blue regions denote the “negative” distances, while the orange denotes the “positive” distances. By clicking on the image, a circle with radius equal to the absolute distance will be drawn.
To draw all 3 circles, we will use a key concept behind signed distance field for non-intersecting shapes: the signed distance field can be computed by taking the minimum of the signed distance of each independent shape. To write this formula for Pygfx to use, we must write a short piece of code in WGSL, a modern programming language for GPU rendering, that expresses the mathematics required to evaluate the SDF above. In Python the full code used to draw our three circles looks like:
Python
For brevity, we’ll start to omit the python code portion in future examples and only include the contents of the custom_sdf string variable which defines our SDF.
The ring
To define a ring, we’ll take the formula for a circle and make it an annular shape of thickness t.
We take care to subtract the thickness from the radius of this shape so that the outer edge of the ring has the same size as the previous three circles.
let coord_use = coord / size * 2;
let thickness = 0.1;
let thickness_half = 0.05;

let radius = 1. / 3.;
let gap = 0.05;
let circle_offset = radius + gap;

let bottom_right_circle = length(coord_use - vec2<f32>(circle_offset, -circle_offset)) - (radius - thickness_half);
let bottom_right_ring = abs(bottom_right_circle) - thickness_half;

return bottom_right_ring * size;
Stay tuned for Part 2!
In the next installment, we'll tackle the more challenging aspects of our logo: the mathematical puzzle of the circle connectors (hint: coins on my desk provided unexpected inspiration!), the outer perimeter with its elegant rounding, and how we solve a real gigapixel microscopy challenge - making the logo look perfect on any background, from dark fluorescence to bright-field images.
Check out Part 2: Perfecting the Details where we complete our journey to a truly pixel-perfect, infinitely scalable logo!
Speakers
.png)
Choosing the Right Well Plate for Your Kestrel: Why Plate Compatibility Matters
Microscopy, Python, and Open Source: Perfecting the Details
