Feature: Color and colormaps for all!

One of the most requested MCAM™ features from our users was the ability to dynamically apply different colormaps to their microscopy data. For some applications, the use of a colormap can help rapidly highlight different regions of interest. In other scenarios, it can convey critical information like which fluorescence marker was used.
For example, on the overview of this 96 well plate containing zebrafish, we can use the turbo colormap to rapidly visualize variations in the lighting across the well plate. While these are hard to discern with a typical grayscale colormap, they are rapidly identifiable with the turbo colormap. Often, these variations are due to changing volumes of liquid across the well plate due to evaporation, or diminished transmission due to condensation on the well plate lid or the small non-uniformities of the illumination when taken across an entire well plate.

One of the most important interactions to perfect is the ability to apply and remove colormaps as the acquisition parameters are changed. In the context of the MCAM™, it is critical that the original data is maintained to ensure continuity in the analysis pipelines. After all, image acquisition is only where the MCAM™ software starts!
To this end, as of version 0.19.62 of our software, the user is able to apply a variety of colormaps to help better visualize any captured image. All of this is done live on the MCAM ™’s included GPU. To enable the colormaps on an MCAM™ with color sensors, , you must first choose the color channel you wish to visualize — either red, green, blue, or their weighted sum as a grayscale image — prior to selecting a colormap.
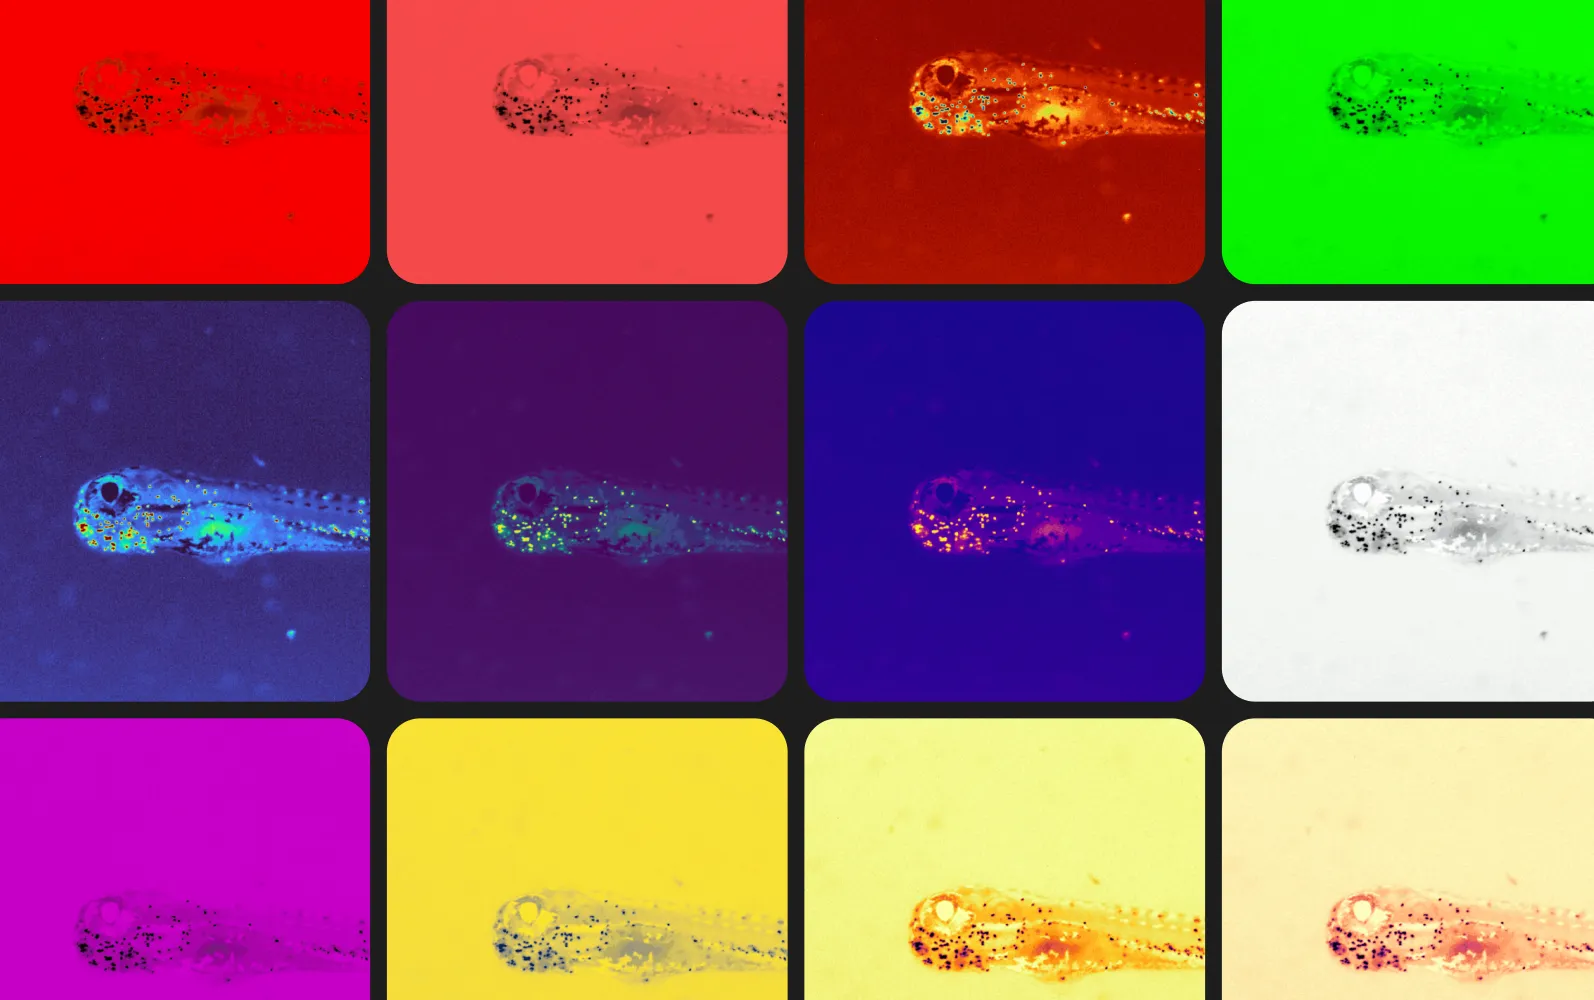
Here we showcase some images taken in similar imaging conditions to those from our recent work on automated quantification of neutrophils in zebrafish in 96 well plate. These little green dots are actually individual neutrophils, a type of white blood cell, that, in healthy animals, migrates to the site of injury to aid in the healing process. If tagged with the appropriate fluorescent reporter, here we are looking at a transgenic line of zebrafish with a GFP reporter (mpx-GFP), they can easily be seen under our MCAM™ microscope. Tracking and keeping count of neutrophils in zebrafish larvae can help us improve our understanding of immunotoxicology as a society.
Using the colormaps available with the MCAM™ software, one can rapidly visualize and assess the quality of the results. Which colormap do you like best? Can you name them all?
Reference:
Efromson, J., Ferrero, G., Bègue, A., Doman, T., Dugo, C., Barker, A., Saliu, V., Reamey, P. Kim, K., Harfouche, M., Yoder, J. 2023. Automated, high-throughput quantification of EGFP-expressing neutrophils in zebrafish by machine learning and a highly-parallelized microscope. PMCID: PMC10462042 https://pubmed.ncbi.nlm.nih.gov/37645798/
Image credit: Mark Harfouche, PhD.
Visit ramonaoptics.com to See More
Feature: Color and colormaps for all!
One of the most requested MCAM™ features from our users was the ability to dynamically apply different colormaps to their microscopy data. For some applications, the use of a colormap can help rapidly highlight different regions of interest. In other scenarios, it can convey critical information like which fluorescence marker was used.
For example, on the overview of this 96 well plate containing zebrafish, we can use the turbo colormap to rapidly visualize variations in the lighting across the well plate. While these are hard to discern with a typical grayscale colormap, they are rapidly identifiable with the turbo colormap. Often, these variations are due to changing volumes of liquid across the well plate due to evaporation, or diminished transmission due to condensation on the well plate lid or the small non-uniformities of the illumination when taken across an entire well plate.
One of the most important interactions to perfect is the ability to apply and remove colormaps as the acquisition parameters are changed. In the context of the MCAM™, it is critical that the original data is maintained to ensure continuity in the analysis pipelines. After all, image acquisition is only where the MCAM™ software starts!
To this end, as of version 0.19.62 of our software, the user is able to apply a variety of colormaps to help better visualize any captured image. All of this is done live on the MCAM ™’s included GPU. To enable the colormaps on an MCAM™ with color sensors, , you must first choose the color channel you wish to visualize — either red, green, blue, or their weighted sum as a grayscale image — prior to selecting a colormap.
Here we showcase some images taken in similar imaging conditions to those from our recent work on automated quantification of neutrophils in zebrafish in 96 well plate. These little green dots are actually individual neutrophils, a type of white blood cell, that, in healthy animals, migrates to the site of injury to aid in the healing process. If tagged with the appropriate fluorescent reporter, here we are looking at a transgenic line of zebrafish with a GFP reporter (mpx-GFP), they can easily be seen under our MCAM™ microscope. Tracking and keeping count of neutrophils in zebrafish larvae can help us improve our understanding of immunotoxicology as a society.
Using the colormaps available with the MCAM™ software, one can rapidly visualize and assess the quality of the results. Which colormap do you like best? Can you name them all?
Reference:
Efromson, J., Ferrero, G., Bègue, A., Doman, T., Dugo, C., Barker, A., Saliu, V., Reamey, P. Kim, K., Harfouche, M., Yoder, J. 2023. Automated, high-throughput quantification of EGFP-expressing neutrophils in zebrafish by machine learning and a highly-parallelized microscope. PMCID: PMC10462042 https://pubmed.ncbi.nlm.nih.gov/37645798/
Image credit: Mark Harfouche, PhD.
Visit ramonaoptics.com to See More
Speakers
.png)
Choosing the Right Well Plate for Your Kestrel: Why Plate Compatibility Matters
.webp)
Microscopy, Python, and Open Source: Perfecting the Details
